
Abstract
Among many colorimetric methods for carbohydrate analysis, the phenol–sulfuric acid method is the easiest and most reliable method. It has been used for measuring neutral sugars in oligosaccharides, proteoglycans, glycoproteins, and glycolipids. This method is used widely because of its sensitivity and simplicity. In this experiment, we used bread that have different kind of treatment and measure the total carbohydrate found in each bread.
Objectives
To determine the total carbohydrates in breads that have different kind of treatment.
Hypothesis
Bread that treat with higher temperature contain lower concentration of glucose.
Material
Phenol 5%: Redistilled (reagent grade) phenol (50g) dissolved in water and diluted to one liter.
Sulphuric acid 96% reagent grade.
Standard Glucose
Stock – 100mg in 100mL of water. Working standard – 10mL of stock diluted to 100mL with distilled water.
Sulphuric acid 96% reagent grade.
Standard Glucose
Stock – 100mg in 100mL of water. Working standard – 10mL of stock diluted to 100mL with distilled water.

Procedures
1. Weigh 100mg of the sample into a boiling tube.
2. Hydrolyse by keeping it in boiling water bath for 3 hours with 5mL of 2.5 N-HCl and cool to room temperature.
3. Neutralise it with solid sodium carbonate until the effervescence ceases.
4. Make up the volume to 100mL and centrifuge.
5. Pipette out 0.2, 0.4, 0.6, 0.8 and 1mL of the working standard into a series of test tube.
6. Pipette out 0.1 and 0.2mL of the sample solution in two separate test tubes. Make up the volume in each tube to 1mL with water.
7. Set a blank with 1mL of water.
8. Add 1mL of phenol solution to each tube.
9. Add 5mL of 96% sulphuric acid to each tube and shake well.
10. After 10min shake the content in the tubes and place in a water bath at 25-30°C for 20min.
11. Read the color at 490nm.
12. Calculate
Result
Calculation
|
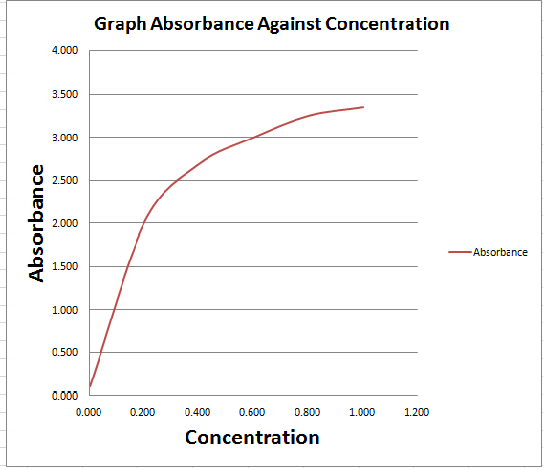
Calculation of concentration of sugar:
Formula Absorbance correspond to 0.1 ml of the test = X mg of glucose 100ml of sample solution contain = (100 mg glucose) X = % of total carbohydrate present. Raw bread: 1.832 = X glucose 183.2 = x/0.1 (100 mg glucose) X = 0.183 % Steam Bread: 1.510 = X glucose 151.0 = X/0.1 (100 mg glucose) X = 0.151 % Toast Bread: 1.476 = X glucose 147.6 = X/0.1 (100 mg glucose) X= 0.147 Percentage of the concentration of glucose Raw bread: 0.183 % Steam bread: 0.151 % Toast bread: 0.147 % |


|
Discussion

Carbohydrates which is also called saccharides are molecular compounds made from just three elements which is carbon, hydrogen and oxygen. Monosaccharides and disaccharides are relatively small molecules. They are often called sugars. Other carbohydrate molecules are very large.
The carbohydrate content of food is one of the main factors influencing how much insulin will be released into your bloodstream after eating it. Whole wheat products contain slightly less carbohydrates, which can help to reduce their impact, to a small extent, on your insulin levels. For example, an average slice of whole wheat bread contains 11.5 grams of carbohydrates and 1.9 grams of dietary fiber per slice, while white bread has 13.7 grams of carbohydrates and 0.8 grams of fiber.
From the experiment conducted, it is undeniable to say that Toast bread has the lowest concentration of glucose which is 0.147 %. This is because the glucose from the original raw bread has been toasted and melted by the temperature supplied and thus will lower the concentration of glucose inside it. People with diabetes may be better off eating toasted bread than raw bread. A study published in the "European Journal of Clinical Nutrition" in May 2008 found that toasting bread lowers the glycemic index. The glycemic index estimates the effect of a food on your blood sugar levels, with foods lower on the glycemic index being less likely to cause spikes in your blood sugar levels than those that are higher on the glycemic index. The toasting and steam bread makes it more difficult for the enzymes to break the starch down into sugar. However, the concentration of glucose for Steam bread is 0.151 % which is higher than the toasted bread. This might be due to the heat supplied to the bread. Some of the glucose inside the toasted bread has higher amount of caramelize sugar and thus will make the concentration of glucose lower.
Insulin spikes are usually caused by a high carbohydrate intake. Insulin is produced by your pancreas whenever your blood sugar levels start rising, which mainly occurs after consuming carbohydrates from breads, potatoes or sugar. A healthy diet can help you keep insulin levels lower to help you stay healthier and reduce your risk of developing type 2 diabetes, polycystic ovarian syndrome, obesity, acne and heart diseases, according to a 2003 article in "Comparative Biochemistry and Physiology." Although whole wheat grain products are higher in fiber, many of them can still induce spikes in your insulin levels.
Phenol-sulfuric acid method.
The phenol-sulfuric acid method is a simple and rapid colorimetric method to determine total carbohydrates in a sample. The method detects virtually all classes of carbohydrates, including mono-, di-, oligo-, and polysaccharides. Although the method detects almost all carbohydrates, the absorptivity of the different carbohydrates varies. Thus, unless a sample is known to contain only one carbohydrate, the results must be expressed arbitrarily in terms of one carbohydrate.
In this method, the concentrated sulfuric acid breaks down any polysaccharides, oligosaccharides, and disaccharides to monosaccharides. Pentoses (5-carbon compounds) are then dehydrated to furfural, and hexoses (6-carbon compounds) to hydroxymethyl furfural. These compounds then react with phenol to produce a yellow-gold color. For products that are very high in xylose (a pentose), such as wheat bran or corn bran, xylose should be used to construct the standard curve for the assay, and measure the absorption at 480 nm. For products that are high in hexose sugars, glucose is commonly used to create the standard curve, and the absorption is measured at 490 nm. The color for this reaction is stable for several hours, and the accuracy of the method is within ±2% under proper conditions.
References
- Miller, G.L., Use of dinitrosalicylic acid reagent for determination of reducing sugar, Anal. Chem., 31, 426, 1959.
- 4. Halton TL, Willett WC, Liu S, et al. Low-carbohydrate-diet score and the risk of coronary heart disease in women. N Engl J Med. 2006;355:1991-2002.
- Anderson JW, Randles KM, Kendall CW, Jenkins DJ. Carbohydrate and fiber recommendations for individuals with diabetes: a quantitative assessment and meta-analysis of the evidence. J Am Coll Nutr. 2004;23:5-17.
- Ebbeling CB, Leidig MM, Feldman HA, Lovesky MM, Ludwig DS. Effects of a low-glycemic load vs low-fat diet in obese young adults: a randomized trial. JAMA. 2007;297:2092-102.
- Retrieved from :
